This write-up provides a broad overview of data sources and reports relevant for an independent researcher or analyst new to exploring data on people experiencing homelessness. The section on HMIS Data focuses specifically on those CoC’s in California supported by PATH (People Assisting the Homeless) – for which a version of this report was initially written under the supervision of Sigrid Struben.
Homelessness data comes in two major forms:
Annual Counts: Collected locally, at the Continuum of Care (CoC)1 level, and then shared by the United States Department of Housing and Urban Development (HUD). These include the annually reported metrics:
HMIS Data: More granular data managed and reported by individual CoC’s via Homeless Management Information Systems (HMIS). CoC administration of an HMIS is both a requirement5 and a resource6.
- CoC’s are responsible for following HUD standards when entering data into an HMIS. This data is used to generate the HUD reported counts.
- HMIS data may be more granular and contain sensitive information. For example:
- Count data that is updated more frequently than the annual metrics released by HUD
- Personal information on specific individuals experiencing homelessness or receiving support services
- Accessing this information often requires completing an intake form, creating an account, and understanding the usage agreements for accessing the information in the system7.
Annual Counts
A quick Google search of “Point-in-Time” counts will likely take you to HUD’s page on Point-in-Time Count & Housing-Inventory-Count. This page contains links to relevant definitions and links to resources and guidance on how HMIS administrators need to manage this data8.
Raw data
Useful to researchers, this HUD page provides links to excel files that contain multiple years of data:
Reports
Across the Hud Exchange website are various reports related to PIT, HIC, System Performance, and related population/sub-population metrics. Together the data in these reports are used to produce the Annual Homeless Assessment Reports9 (AHAR)10. An annual report is sent to congress each year summarizing the state and trends of homelessness in the nation11.
HUD Supported Research
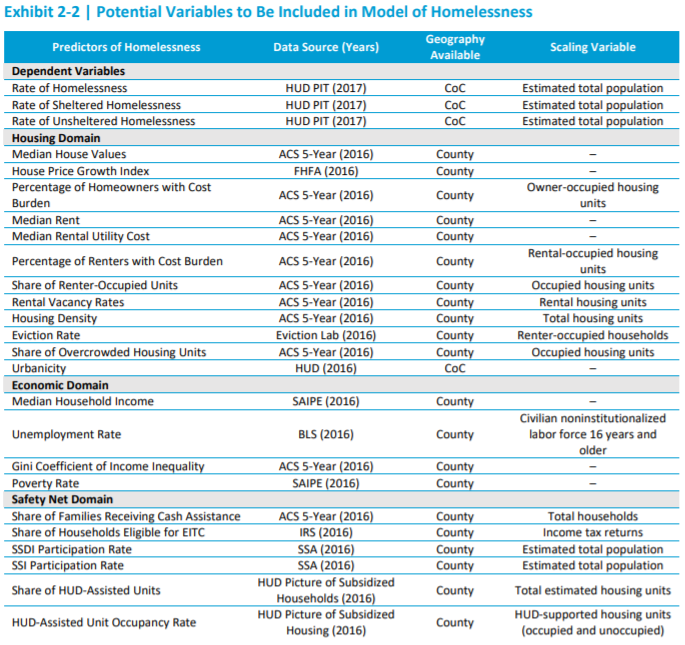
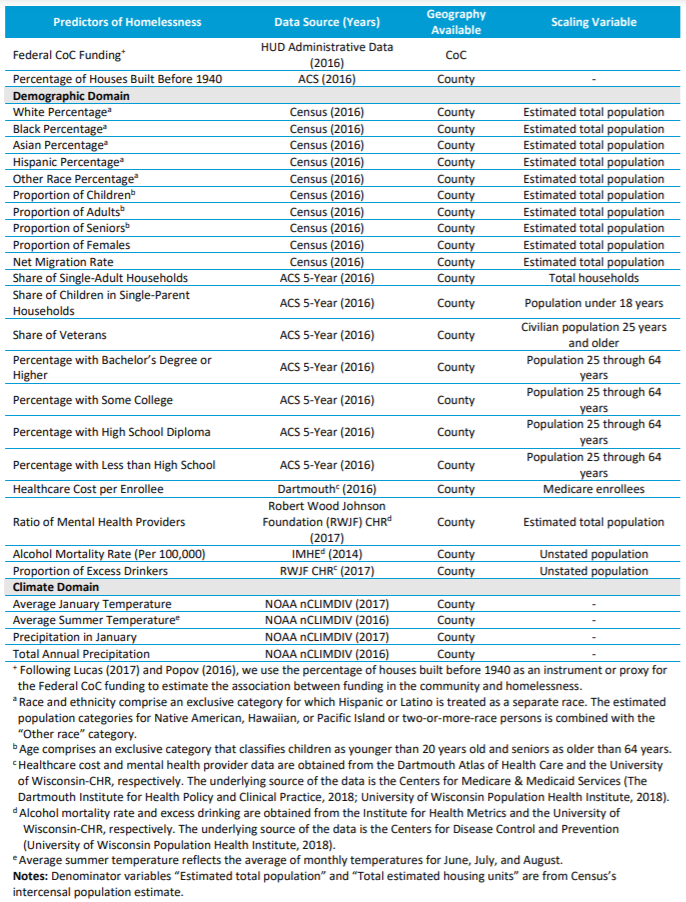
HUD and other government agencies release and support research on people experiencing homelessness. Market Predictors of Homelessness: How Housing and Community Factors Shape Homelessness Rates Within Continuums of Care is a helpful resource that reviews the association of a variety of types of factors (housing, economic, safety net, demographic, climate) on rates of total, sheltered and unsheltered homelessness. The paper’s findings are most confident regarding the impact of housing on homelessness:
“Across the country, housing market factors more consistently predicted rates of total homelessness than other economic factors.”
Specifically that:
“High median rents, overcrowding, and evictions were particularly strong predictors of total homelessness rates in urban areas and tight, high-cost housing markets. Holding these factors constant, the study finds that increased housing density is protective against homelessness.”
The study finds a variety of other factors that explain variance in homelessness rates. However these relationships are more complicated and vary between regions, sub-populations, and the category of homelessness being reviewed.
Outside of its findings, the paper may be useful to researchers for a number of reasons:
- Contains references to major research papers investigating associations and causes of homelessness.
- “DATA” section describes relevant information on data collection and processing. See Appendix for a table of Data Sources copied from the report.
- Which factors came from which public data sources (e.g. HUD, census, ACS, FHFA, SAIPE, etc.).
- Whether that data was available at either the CoC, County, or another level (and how the cross-walk between these different levels of analysis was done).
- The huduser page also provides the actual data that was used for modeling and analysis.
Considering the administration under which a HUD research report is released may be important. The above paper is produced by independent researchers in collaboration with HUD and, at its face, appears to be a good-faith investigation12.
Appendix
HMIS Data
This section identifies relevant websites for accessing HMIS data for each CoC served by PATH.
Accessing HMIS data13 varies by CoC depending on the associated policies and technology vendor(s) the CoC uses for administering their HMIS. For researchers interested in using HMIS data for reviewing PATH (which operates across multiple CoC’s in California) this likely requires gaining access to the HMIS data for several CoC’s. Note also that policies on data access use may vary by CoC14. Below are links and notes concerning the HMIS for each CoC where PATH operates.
- General data and Power BI dashboards are available here
- Access to data requires creating an LAHSA Account and indicates that the data portal is intended for homeless service providers15
Requires intake for access, see User Central for key forms and documents.
There are several dashboards available that do not require creating an account16. This short YouTube video provides a helpful overview for the “Community Performance Dashboards”, “Project Performance Dashboards”, and “System Performance Measures.” There are also dashboards on Racial Disparity Analysis and Point in Time data17 (not mentioned in the video).
Link to data. Looks as though there is pretty good documentation on how to do a data export and generally a good amount of documentation generally on how to use the tool18.
Link to details on the kinds of reports that are available. It appears as though Orange County likely charges providers based on the number of users accessing the account19
Business Intelligence
I did not see business intelligence dashboards directly on HUD’s site related to most annual measures (excluding for CoC System Performance Measures). However I did find other sources with data related to these national counts:
- Simtech Solutions20 provides a Point in Time Tableau dashboard with views on:
- State and CoC Selection
- State Summary
- CoC Summary
- Homeless Totals for State
- Individuals & Families for State
- Individuals & Families for CoC
- Capacity Utilization for State
- Capacity Utilization for CoC
- Homeless Totals by User
- Sheltered & Unsheleted by User
- Individuals & Families by User
Other Resources
- Post Alley Article explaining the limitations and potential biases that can arise in PIT data.
- Planet Money’s podcast on Counting the Homeless is a helpful starting place in terms of the origins of the PIT and efforts to provide permanent housing to the chronically homeless. The host mentions Mary Cunningham with the Urban Institute where a variety of relevant research on homelessness is also available21.
- Genelle Denzin’s blog Reporting Notes is perhaps more useful for HMIS administrators and analysts more than researchers but is a good example of “open source” based approaches to analyzing and managing homelessness data.
- Another resource from the R community, this blog post (and a related one22) show examples of open source analysis and visualization of homelessness data.
- The Service Prioritization Decision Assistance Tool is a tool used by service providers to determine when and what kind of assistance to provide to homeless and at risk individuals. Some have called for changes or alternatives to the tool.
Data Sources
Table copied from pages 21 and 22 of Market Predictors of Homelessness: How Housing and Community Factors Shape Homelessness Rates Within Continuums of Care.
A CoC typically encompasses a major city or county or collection of counties that manage grants and funding for homelessness programs in their area and manages data and metrics in this area. For example Los Angeles, or San Diego and greater region. Several low population counties will often be grouped together to form an individual CoC.↩
Defined as: “A count of sheltered and unsheltered people experiencing homelessness on a single night in January.”↩
Defined as " a point-in-time inventory of provider programs within a Continuum of Care that provide beds and units dedicated to serve people experiencing homelessness (and, for permanent housing projects, where homeless at entry, per the HUD homeless definition), categorized by five Program Types: Emergency Shelter; Transitional Housing; Rapid Re-housing; Safe Haven; and Permanent Supportive Housing."↩
Since 2015, CoC’s have had to meausre performance as a coordinated system (source).↩
As part of federal funding statutes.↩
For management and analysis of information on people experiencing homelessness.↩
As an example, here is a link to Santa Barabara’s consent form that walks through what data will be collected and the policies therein. This follows federal guidelines but may vary some between CoC’s.↩
Many of the resources across HUD seem designed more for administrators than researchers. Also the various .pdf reports of state level data will likely be viewed as unwieldy for a researcher.↩
Also can see Power BI dashboard link here but is out of date.↩
See Appendix for notes on data presented through Business Intelligence tools.↩
Of particular note to PATH in the 2020 report is the recent increase in homelessness in California (16.4% increase between 2018 and 2019). This goes against trends in prior years and in other parts of the nation. However see Post Alley Article describing how PIT data and year over year changes may or may not be reliable.↩
Some findings in the report could be construed as being highlighted due to partisan motivations (e.g. those regarding the relationship between migrant inflows and unsheltered homelessness or those highlighting homelessness in west-coast urban areas), however this could also just as well not be the case. My view that this paper was ‘written in good faith’ is a subjective assessment. In comparison, The State of Homelessness in America from the Council of Economic Advisers appears to be more influenced by partisan attitudes. Someone with more experience in the relevant literature may be in a better position to make these judgments.↩
Which has the potential advantage of being more granular and not just collected annually.↩
For example LA’s HMIS defaults to only grant data for services providers while Greater San Diego’s HMIS allows access to data but requests that the office be notified if the data be used in press or research reports.↩
I did not have a PATH email so was unable to create an account as was the case for gaining access to most HMIS data in other CoC’s reviewed.↩
However they request that their office be contacted if information therein is republished.↩
This was linked to previously in [Reports and Dashboards].↩
I noticed that as of November, 2020 they were flirting with the idea of charging a fee to participate in the Orange County HMIS that looked as though, based on the minutes, it likely passed.↩
Simtech Solutions seems to be a for-profit business intelligence vendor specializing in helping CoC’s build dashboards and business intelligence tools off of the data in their HMIS systems. This particular dashboard seems to primarily represent a way for them to market themselves to HMIS’s by showcasing the kinds of visualizations they are able to make on national data sources.↩
While not directly related to people experiencing homelessness, the Urban Institute’s analysis on Where to Prioritize Emergency Rental Assistance to Keep Renters in Their Homes is an interesting and relevant example of their work. However I did not find the datasets on the Urban Institute’s website particularly useful for homelessness specific data.↩
Second post shows how he loaded in and cleaned the data – note though that the data source has changed from where it was at the time of this post.↩